Navigation Tutorial
Lesson 1 - Map Reading
All content copyright © Ashley Burke 2008. Not to be copied, duplicated or used for any purpose without permission.
Navigation Tutorial Lesson 1 - Map Reading
All content copyright © Ashley Burke 2008. Not to be copied, duplicated or used for any purpose without permission. |
Navigation course by Ashley Burke
2. Interpreting Contour Features
As discussed in Section 1.2, contour lines on a topographic map represent steeper ground if they are closer together, and gentler ground if they are further apart. In fact, contours on topographic maps tend to form recognisable patterns depending on the form of the land surface that they represent. Land surface features such as hills, ridges, valleys, spurs and gullies are all depicted by recognisable patterns of contours on a map. Being able to form a mental picture of the surface of the ground by studying the arrangement of contours on a map is one of the key skills to navigation.
In this section we will examine what map contours look like for some common landforms. With this information you will be able to study a map, interpret the contours and form a mental image of the ground represented by the map. This is an essential skill, both in trip planning, and also while en route, as it allows you to make predictions about the terrain that you are heading into.
A gully is a small sloping watercourse - a small valley with a sloping profile. On the map a gully is represented by a series of contours nested within eachother in a V or U shape where the outermost contours in the V or U represent higher elevations. See Figure 2.1.
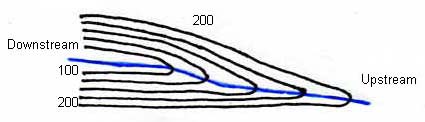 |
These contours depict a gully because they are nested within eachother in a V or U shape and the outermost contours are at a higher elevation than the innermost contours. The map cartography will often aid in the interpretation by marking watercourses and creeks in blue as shown. |
| Fig 2.1 |
A spur is a sloping ridge - a ridge that rises from a valley or other low ground, or descends from a peak or range. Like gullies, a spur is represented by a series of contours nested within eachother in a V or U shape. However spurs differ from gullies in that the outermost contours in the V or U represent lower, not higher elevations. See Figure 2.2.
 |
These contours depict a spur because they are nested within eachother in a V or U shape and the outermost contours are at a lower elevation than the innermost contours. |
| Fig 2.2 |
A cliff is where the ground is so steep it is vertical or nearly vertical. Some topographic maps have special markings to represent cliffs, whereas on other maps there are no cliff markings and contours become so close to each other they simply fuse together. For example, NSW 1:25000 maps do have cliff markings, whereas Tasmania 1:25000 maps do not. Figure 2.3 shows different representations of cliffs on two different topographic maps.
Example of map where cliffs are marked. NSW 1:25000 map |
Example of map where cliffs are not marked and the contours just fuse together. Tasmania 1:25000 map |
 |
 |
| Fig 2.3 |
A word of caution: if a map marks cliffs, do not assume that there are therefore no cliffs in areas not so marked. Frequently you will encounter cliffs in places where none are marked on the map. Any region of a map where contours come close together, particularly on maps with a 20m contour interval, you can suspect that cliffs are there that may be hard to negotiate.
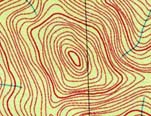
Hills, knolls or peaks can be recognised on maps as being where the contours are in closed loops, with one or more contours inside eachother, as shown in Fig 2.4.
 |
|
| Fig 2.4 |
2.5 Depressions
A depression is an area of ground that is surrounded in all directions by higher ground. For example, volcanic craters, quarries and limestone sink holes. As with hills, depressions appear on maps in the form of closed loops of contour lines. To distinguish depressions from hills, maps will normally show short inward pointing bars on countour lines that represent depressions. See Figure 2.5.
In the Blue Mountains the sorts of landscapes that might exhibit depression contours are generally rare. A quarry or open cut sand mine would be the only landscape in the Blue mountains likely to classify as a depression. Depressions are more likely to be observed in New Zealand and Papua New Guinea, where wide areas of limestone country form extensive depressions. Depressions can also be noted on glaciers and ice fields on some maps of New Zealand.
 |
|
| Fig 2.5 |
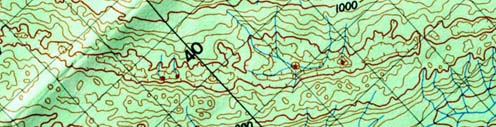
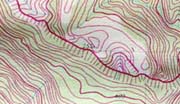
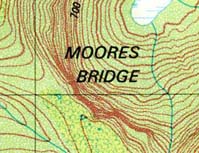
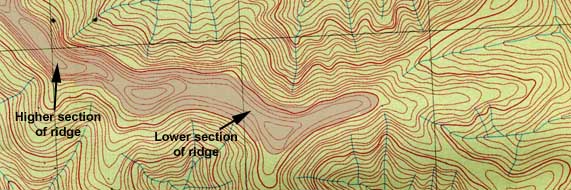
A ridge is a range of hills or mountains. It can also be thought of as the high ground or watershed that divides one valley from the next. On a topographic map it will be depicted by two contours of equal elevation (often these are the same contour) running side by side for a distance. These parallel contours usually diverge from eachother as the elevation of the ridge rises and and converge toward eachother as the elevation of the ridge falls.
If the elevation along a ridge falls by more than one contour interval, the two contours will join, creating a spur. If the elevation along a ridge rises by more than one contour interval, a new contour is formed (this is the same thing viewed in a different direction). Figure 2.6 shows a typical ridge formation, with rises and falls along the length of the ridge causing the contours to diverge and converge in the manner that I have just described. In Figure 2.6 I have shaded a region of ridge on this map. Note the parallel contours that diverge and converge, and the closed loops within these parallel contours. These closed loops represent bumps or knolls along the ridge.
 |
| Fig 2.6 |
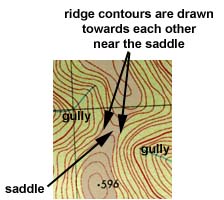
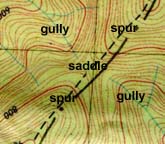
A saddle is a point on a ridge which is lower in elevation than points in either direction along a ridge. ie: it is a dip in the ridge, or the low ground between two hills that lie along the one ridge. Saddles exhibit the following contour features:
In the example below, the dotted line follows the ridge in which this deep saddle is found. This saddle shows facing spurs and gullies either side. |
In this example, the shaded region is the ridge. The saddle is where shown. |
 |
|
| Fig 2.7 |
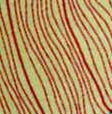
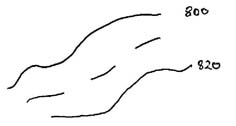
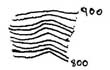
Sloping ground is depicted on the map by the presence of contours. Wherever the map shows contours, this is an indication of sloping ground in some shape or form. Some of these forms have already been discussed. The steepness of the sloping ground is indicated by how close together the contours are. The closer together the contours, the steeper the ground. Figure 2.8 shows the difference in the way steep and gentle slopes are depicted.
Steep slope - contours are close together. |
Gentle slope - contours are far apart. |
 |
|
| Fig 2.8 |
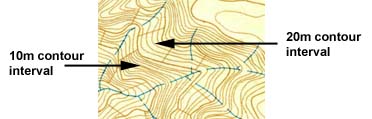
On very steep slopes the contour lines may be so close together there is no space between them. This can be depicted as contours merging together as already described for cliffs in Section 2.3 . On other maps, the contour interval may be doubled over the region of steepness, meaning that every second contour is omitted. On such maps, vertical bars mark the boundary where this omission of every second contour occurs. See the example in Fig 2.9.
|
|
| Fig 2.9. Steep slope depicted by a doubling of the contour interval. |
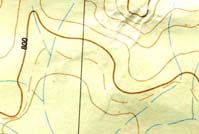
For gentle slopes where contours are spaced far apart, some maps introduce auxiliary contours to effectively halve the contour interval and introduce more detail. Examples of such maps are the NSW first edition 1:25000 maps with a 20m contour interval. On some areas of these maps auxilliary contours are introduced as broken lines, taking the contour interval down to 10m. See Fig 2.10.
 |
|
| Fig 2.10. Gentle slope with auxiliary contours. |
2.9 More Subtle Contour Features
So far we have discussed the macroscopic features of landscapes such as hills, gullies, ridges and so forth. Often when navigating we need to study the map and our surroundings in more detail in order to gain the information needed to navigate accurately and confidently. An important skill of navigation is attention to detail. Even the slightest bend, wiggle or bump on a contour line tells you something about the landform that it represents. A common mistake is to overlook such features when studying a map, thereby missing out on important information which may prove vital in enabling you to determine your position from the map and identify the features around you.
Here are shown just a few of the more common contour features that are more subtle and less obvious than those already discussed. Most of these features are landforms already discussed, such as saddles, knolls, gullies and spurs. The difference is a question of scale. These features are smaller versions of those already discussed, and therefore require more detailed inspection of the map to discern.
This is a knoll or bump along a ridge that is too small to generate its own closed loop contour. Where the ridge contours diverge and then converge again is a sign that there is a small hill less than one contour interval in height above the surrounding ground. The top of the hill or bump can be assumed to be near where the contours are furthest apart. |
|
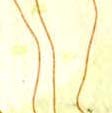
| This is a saddle which is not deep enough to cause two parallel contours of the same elevation to cross the ridge and connect. Instead, parallel ridge contours come closer together, as if pinched, but without actually joining. The lowest point in the saddle may be assumed to be near where the contours are closest together. | |
 |
This is a dent in the side of a ridge or slope. It may be the beginnings of a gully that is too high in the headwaters to form a channel or watercourse. |
| This is a bump on the side of a ridge or slope. It may be an outcrop of land on a slope causing localized flattening or the slope, or it may be the top of a small spur blending into the slope. |
Web page created 12 Jul 2008, last updated 12 Jul 2008. All content copyright © Ashley Burke 2008. Not to be copied, duplicated or used for any purpose without permission. |